Ray Lowstetter
I study how institutions determine value and how those definitions impact their decision making. My research specifically focuses on insurance companies and how cost-sharing features create financial barriers to care. When I’m not getting lost in numbers and data, I’m probably reading a Russian novel or on the dance floor.
Skills
- Health Economics
- Economic Sociology
- Policy analysis
- Data Visualization
- Complex Survey Design
- Weighted Data
- Time Series Analysis & Forecasting
- Multivariate Analysis
- R
- SPSS
- Stata
- SQL
- dplyr
- tidyverse
- R survey package
- R Shiny
- GGPlot
- Tableau
- ArcGIS
- Python
- Excel
- VBA
Publications & Conference Presentations
An overview of papers I’ve published and any conferences I’ve presented at.
Conference Presentation - The Contradictions of Moral Hazard: Analyzing the Outcomes of Moral Hazard in Health Insurance
Published Paper - The Sacred and the Profane: An Analysis of the Rhetoric in David Brower's Campaign to save the Grand Canyon
This study examines David Brower’s New York Times advertisements in the 1964–68 Grand Canyon controversy. The essay argues that Brower creates a dichotomy between the sacred and the profane, using both discursive and nondiscursive rhetorical techniques. Such an examination adds to our understanding of rhetoric in environmental controversies and, more generally, to our knowledge of argument by comparison.
Experience
Research Assistant
Assisted with research project studying the relationship between small business owners and community banks. This research conducted qualitative interviews with leaders at community banks as part of an exploratory analysis for a larger project looking to understanding the challenges that small business owners face.
- Assisted with qualitative interviews with Community Bank leaders to understand how they build relationships with their small business clients.
- Cleaned transcripts and coded interviews to identify key themes and conducted qualitative analysis.
- Wrote report summarizing findings for the lead researcher to inform what questions should be included in the longitudinal survey of small business owners.
- Found relevant quantitative data and created data visualizations to support the qualitative findings in the report.
Intern
Contributed to creating a Career Pathways Resource to help individuals navigate their careers in Healthcare and Public Health.
- Developed Career Pathways resource that details various different career paths in healthcare and public health, providing information to individuals on available resources that support their career goals.
- Drafted, conducted, and interviewed 21 healthcare and public health professionals regarding their career pathway to understand the nuances of their career and their success.
- Designed print and video media to display interviews in the print and online Career Pathways Resource. Utilized Adobe Photoshop, Adobe Premiere, and Canva software to design professional media.
Program Manager
- Managed projects with budgets over a million dollars. Used Jira to manage team workloads and ensure project deadlines were met. Created custom Jira automation to generate dashboards, visualizations, and reports for managers throughout the company.
- Coordinated QA efforts to test, train, and implement development of proprietary AI model running RFP (request for proposal) intake for employee benefit premiums.
- Implemented technical solutions for insurance carriers to test compliance language and actuarial data to ensure accurate pricing and compliance language.
- Formatted data to send to insurance carriers for processing using Employee Benefit software (Employee Navigator, bSwift, Selerix, PlanSource).
- Created training materials for all nRollTech teams, empowering managers to efficiently onboard and cross-train employees.
Teacher
- Worked at a charter school for students with reading disabilities where I developed alternative reading and comprehension techniques to assist students.
- Reduced the grade level gap for my students with disabilities to prepare them to move into traditional high school settings.
- Gathered data to make informed decisions to improve the learning experience for my students and create custom assignments for their skill level that included hands-on enrichment activities.
- Incorporated diverse experiences into the classroom for my students from diverse backgrounds to relate to historical and prominent figures.
Education
DePaul University
- Final Paper: “Impact of Pandemic Era Policies on Financial Barriers to Healthcare: How Insurance Design Impacts Healthcare Access”
- Quantitative Coursework: ArcGis, Data Visualization, Time Series Analysis & Forecasting, Data Analysis
- Graduate Student Assistant (2025-2026): Tutored undergraduate and graduate students in statistics and data analysis. Supported students’ research by advising them on research design, data cleaning, quantitative analysis, and writing.
Furman University
- Senior Thesis: “A Return to Morality: Kantian International Conflict Resolution,”
- Independent Study: “Mediocrity: Michel de Montaigne’s Guide to Living”
- Awarded Best Paper in Music Department for “The ‘Oratorio Problem’: Christus as a Devotional Work.” (2015)
- Studied music and art in Italy.
- Tocqueville Fellow
- Treasurer of Political Thought Club
- Vice President of Sigma Alpha Iota
- Political Science Faculty Award (2016)
- Teaching Assistant (2015): Tutored students in Music History II. Assisted students with their research papers. Held regular office hours to provide one-on-one guidance to students. Hosted study sessions to help students prepare for tests.
Service
DePaul University
Ran organization with the express missions of:
- Creating a space to support DePaul University Graduate Students.
- Amplify graduate student research at DePaul.
- Connect DePaul LAS graduate students across departments. To that end I coordinated social events for graduate students, ran meetings, assisted students with concerns via discord.
DePaul University
- Planned Symposium for DePaul graduate students to present their research publically.
- Created Marketing Materials.
- Handled event planning including catering, booking space, ensuring technical features were working for students, managed volunteers.
- Reviewed Alumni profiles and selected Alumni to be awarded and give a speech at the Symposium.
- Reviewed student applications to present and assisted students with preparation.
- Connected with Professors to be moderators on panels for students and to provide students with feedback on their research.
Chicago Ethnography Conference
- Conducted outreach for fundraising.
- Worked within the budget to create a space for graduate students in Chicagoland to come together learn ethnographic methods.
- Recruited faculty and researchers to present workshops on Ethnographic Methods.
Blog
A place for me to refine and improve my thoughts and ideas.
Super PAC Spending in 2024 Senate Race
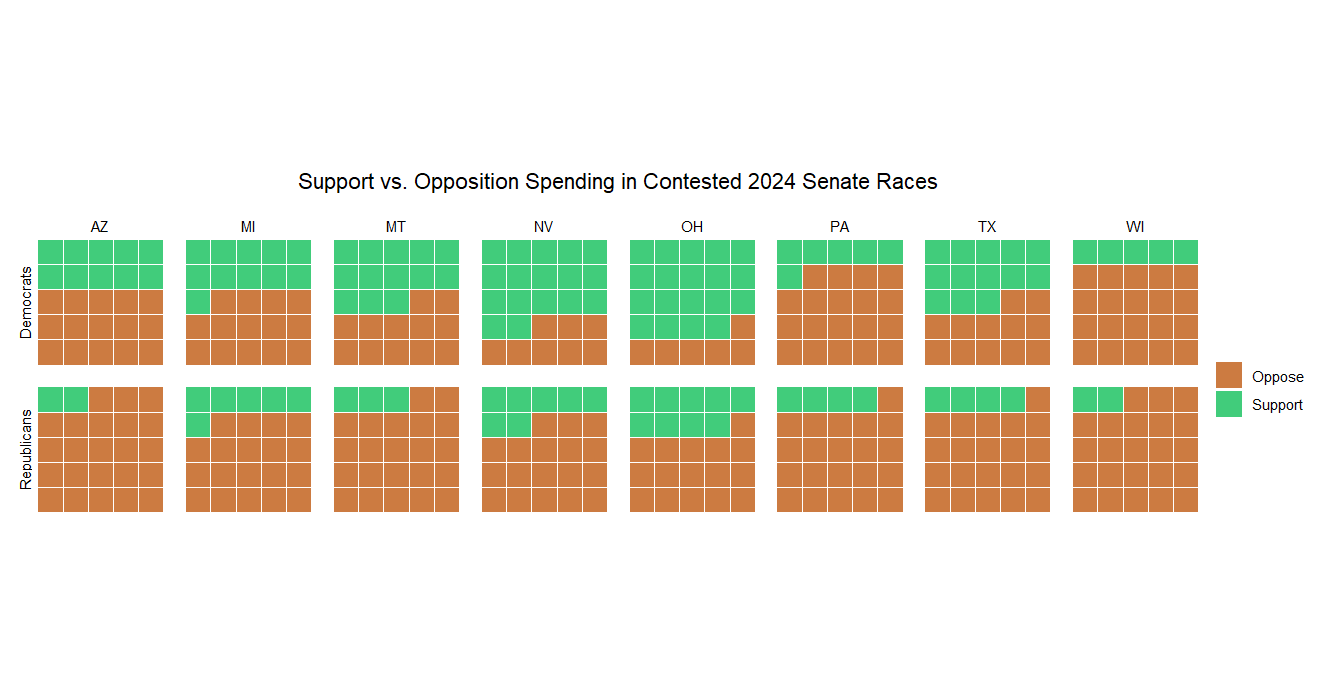
I wanted to get back to my roots in Political Science briefly and explore how money influences elections. Campaign finance is a complex issue and more money doesn’t necessarily lead to winning an election, but Super PAC spending has ballooned in the past decade and I thought it was worth exploring further. I created the following two visualizations and they tell a striking story. The scatter plot highlights how the most contested races get the most Super PAC money–this should not be terribly surprising. But I wanted to explore this further so I created the waffle plot and it shows that Republicans in contested races seem to spend a significant portion of their money opposing their opposition rather than supporting their candidate; whereas, Democratic Super PACs vary in oppositional or supportive spending.
Since cross-domain resizing is non-trivial, I wrote the following shortcode that takes the name of your app as its first argument and the number of vertical pixels as its second argument.
Data Source(s): FEC Data 2024
Urgent Care Clinics In Duval County
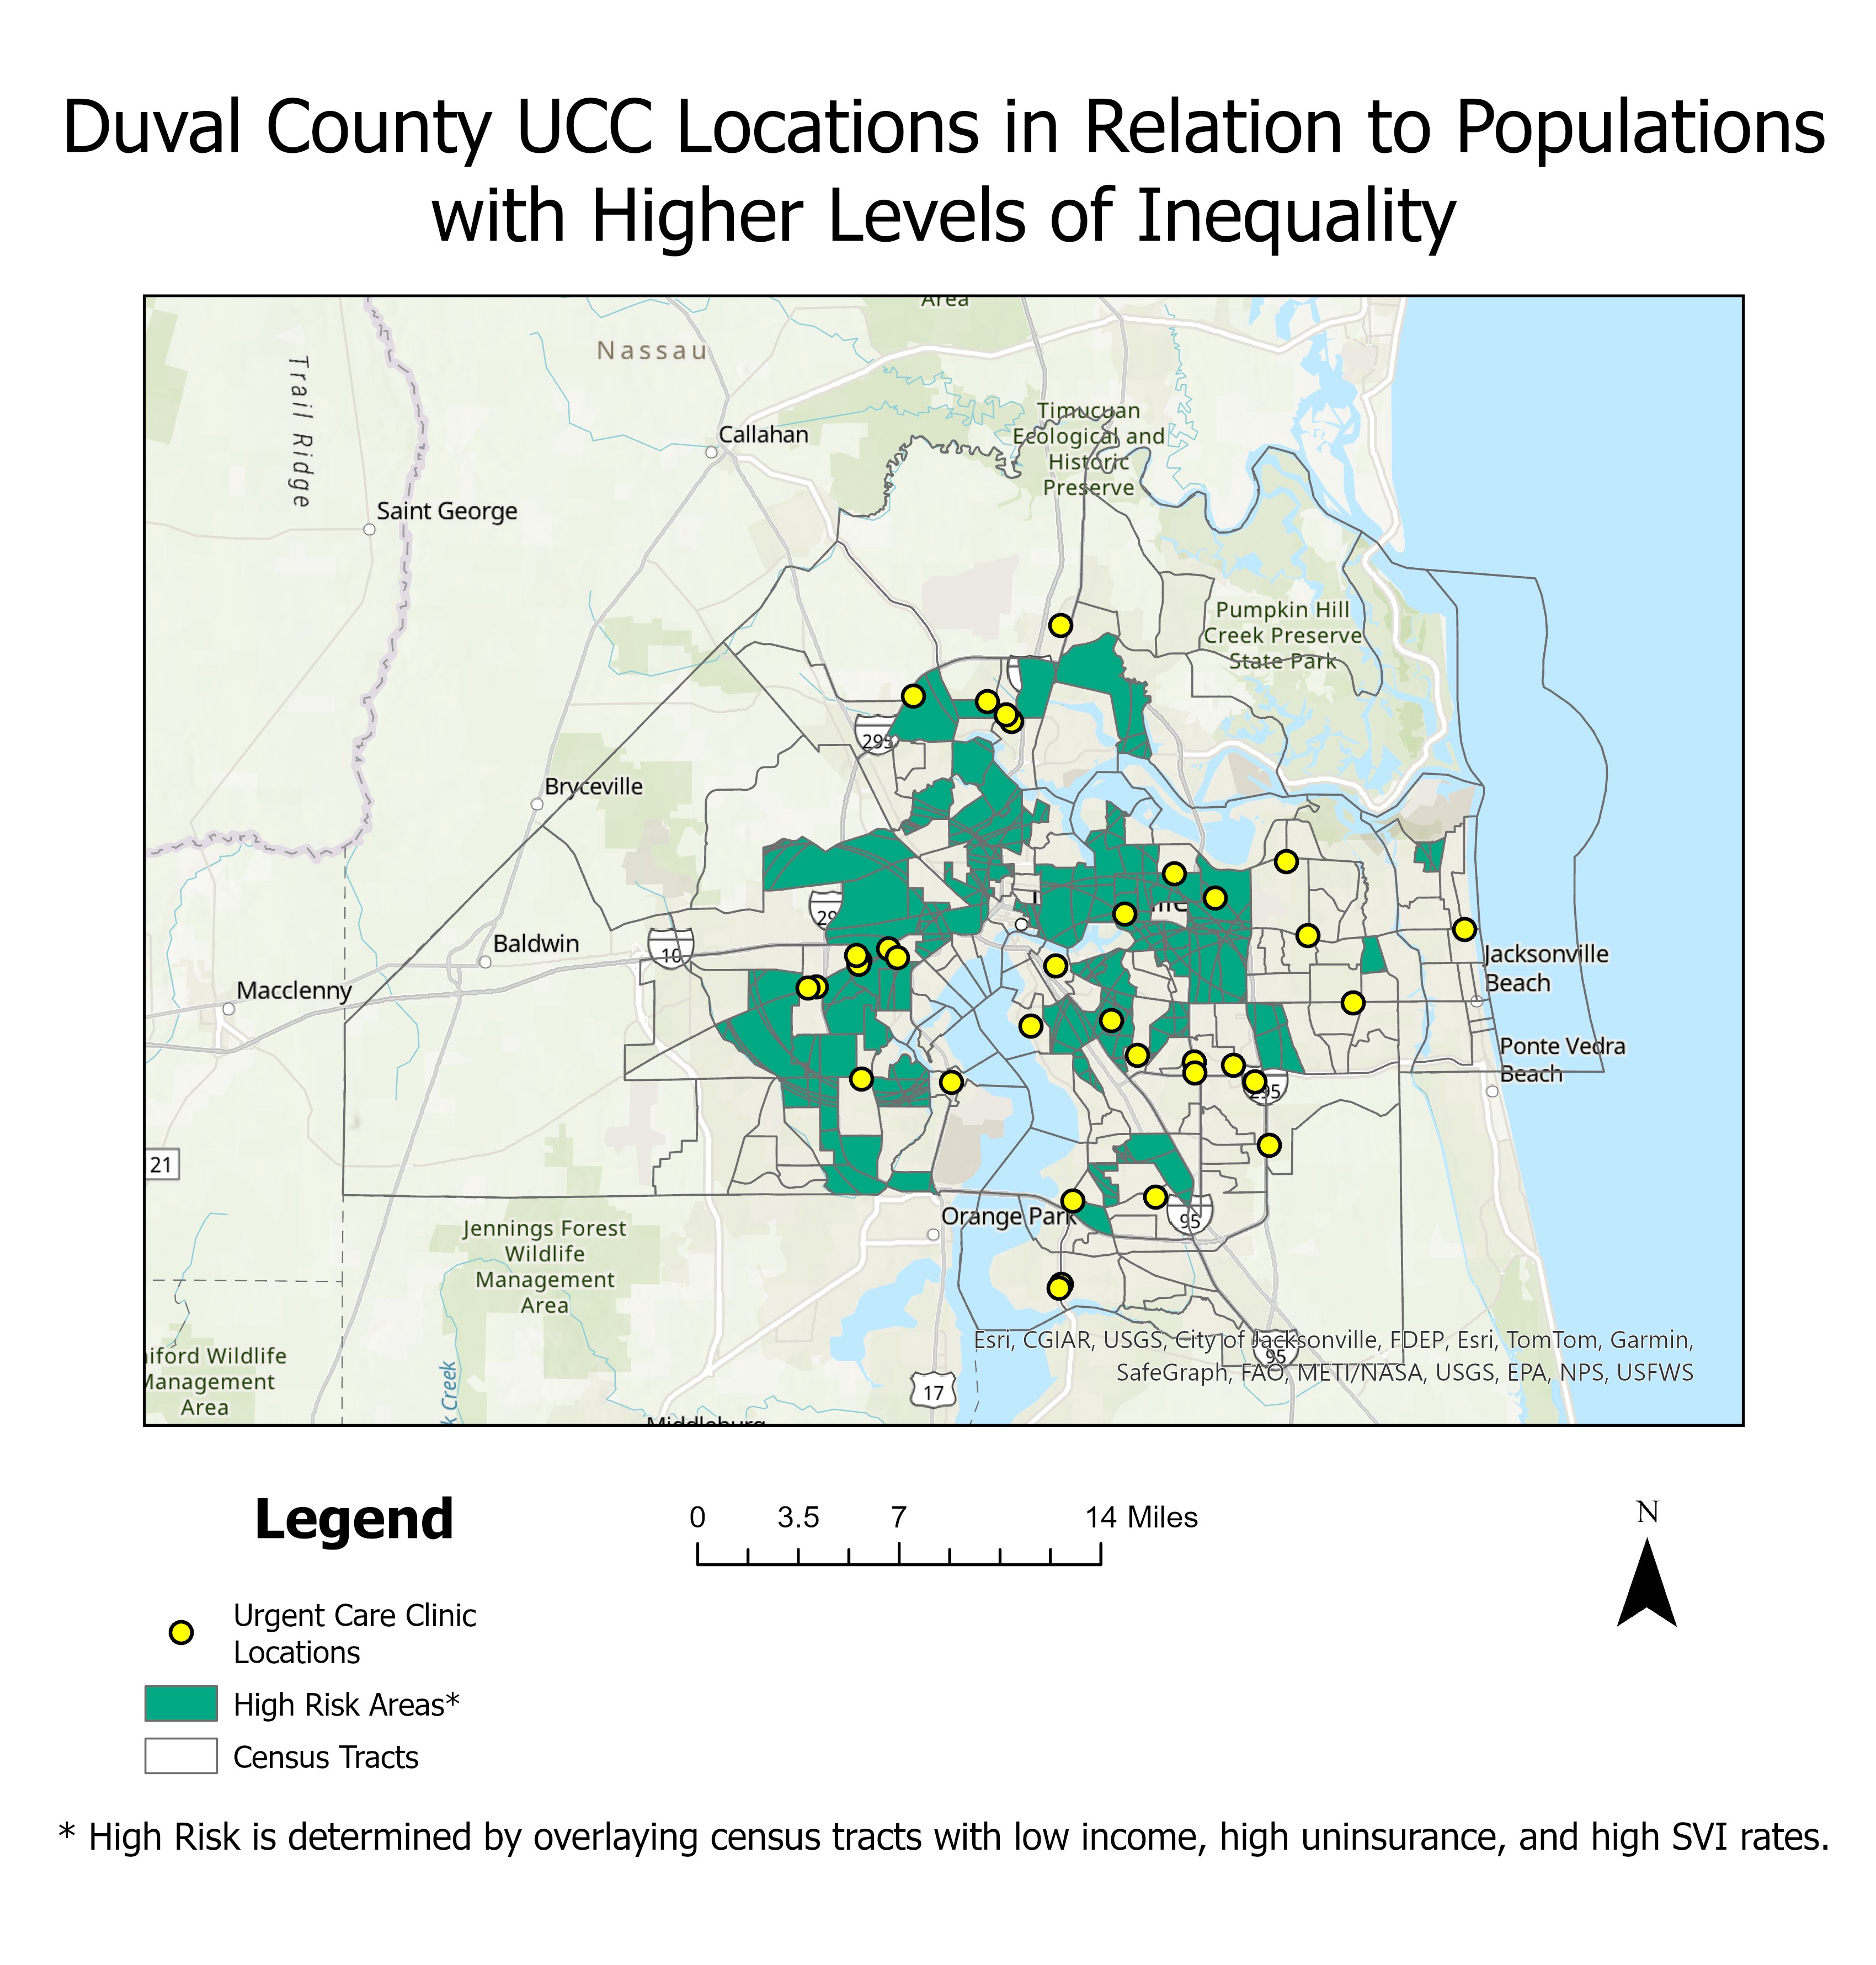
I’ve noticed that primary care has changed over the years. From 2000-2026 there’s been a large increase in Urgent Care Clinics. This makes primary care accessible and affordable, but also means that there’s a decline in primary care doctors who own their own practices. I wanted to explore where these Urgent Care Clinics were located to see if there’s any trends on which areas and neighborhoods are being choosen and if at risk communities in Duval County, where I used to live, could easily access these places or not. Using ARC GIS I created a layer that found census tracts that are at risk and then also mapped the location of Urgent Care Clinics. Overall, there was pretty good coverage in Duval County, but I think it would be compelling to expand this research to look at rural communities and their accessibility to primary care. This is an ongoing topic of interest understanding how private equity is reshaping healthcare in the US and the pros and cons of these changes.